728x90

순서대로 진행하면 된다


728x90
728x90


UserWarning:
The dash_html_components package is deprecated. Please replace `import dash_html_components as html` with `from dash import html` import dash_html_components as html


From Dash version 1.xx to 2.xx

728x90
728x90

HTML

<div id="main">
    <div class="item">1</div>
    <div class="item">2</div>
    <div class="item">3</div>
</div>

CSS

#main {
  display: grid;
  grid-template-columns: repeat(3, 1fr); /*컨테이너에 Grid 트랙의 크기들을 지정해주는 속성*/ /* 열(column)의 배치*/ /*열이 3개니깐 1fr이 3개다*/
  grid-template-rows: repeat(9, minmax(100px, auto));
}

.item:nth-child(1) {  
	grid-column: 1 / span 1;	/*열 1번 칸에서..*/
	grid-row: 1 / span 10; 
}

.item:nth-child(2) {	
	grid-column: 3 / span 1;  	/*열 3번 칸에서..*/
	grid-row: 1 / span 10; 
}

.item:nth-child(3) {	
	grid-column: 2 / span 1;  	/*열 2번 칸에서..*/
	grid-row: 1 / span 10;  
}


CSS

#main {
  display: grid;
  grid-template-columns: repeat(24, 1fr); /* 열(column)의 배치*/ /*열이 24개이며, 사이즈는 1fr 동일*/
  grid-template-rows: repeat(9, minmax(100px, auto));
}

.item:nth-child(1) {  
	grid-column: 1 / span 5;	/*열 1번 칸에서..*/
	grid-row: 1 / span 10; 
}

.item:nth-child(2) {	
	grid-column: 20 / span 5;  	/*열 20번 칸에서..*/
	grid-row: 1 / span 10; 
}

.item:nth-child(3) {	
	grid-column: 6 / span 14;  	/*열 6번 칸에서..*/
	grid-row: 1 / span 10;  
}

728x90
728x90

Adding a unit to x axis labels in plotly.js


How to use it sets the tick label suffix plot.ly.

728x90
728x90

How to change the way numbers are displayed in plot.ly graph. - Plotly

I don't want to use this method in this graph.

So I solved it.

tikformat was used as the solution.

var layout = {

    xaxis : {

    tickformat: '0.0f'

   }

}
728x90
728x90

모드바에서 특정 버튼 제거 방법

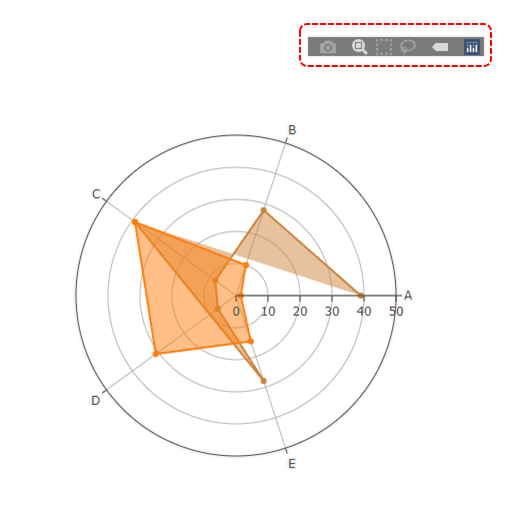
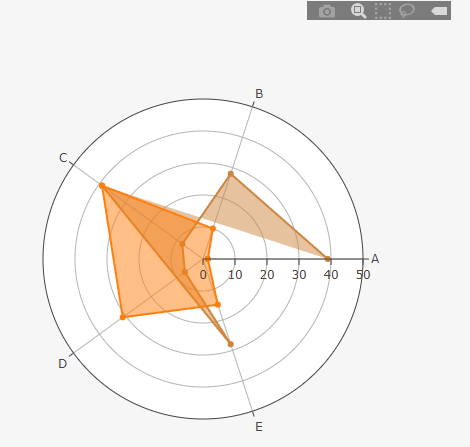
1. Put the mouse on top of icon.
2. You can check which one it is.
3. If it comes out as Compare data on hover, the appropriate hoverCompareCartesian will be the answer.


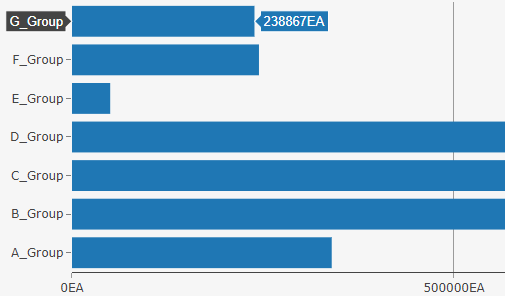
hoverCompareCartesian :  Compare data on hover

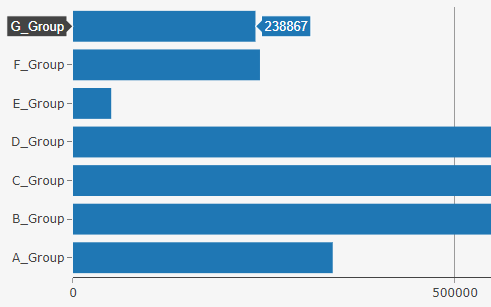
hoverClosestCartesian :  show closest data on hover

toggleSpikelines : toggle spike lines

resetScale2d : reset axes

autoScale2d : autoscale


If there's anything you want to find, do Ctrl + F.

list of all the modebar buttons

  • 2D
    - zoom2d, pan2d, select2d, lasso2d, zoomIn2d, zoomOut2d, autoScale2d, resetScale2d
  • 3D
    - zoom3d, pan3d, orbitRotation, tableRotation, handleDrag3d, resetCameraDefault3d,
      resetCameraLastSave3d, hoverClosest3d
  • Cartesian
    - hoverClosestCartesian, hoverCompareCartesian
  • Geo
    - zoomInGeo, zoomOutGeo, resetGeo, hoverClosestGeo
  • Other
    - hoverClosestGl2d, hoverClosestPie, toggleHover, resetViews, toImage,
      sendDataToCloud, toggleSpikelines, resetViewMapbox
728x90
728x90


Plotly.js Chart를 사용하면서 필요하지 않는 도구모음의 경우 제거, 제거 방법은 아래와 같다.

lasso2d : 올가미
select2d : 사각형 선택
displaylogo : plotly 로고 제거


다른 도구모음 추가나 제거의 경우 아래 링크에서 알아 볼 수 있음.

https://github.com/plotly/plotly.js/blob/master/src/components/modebar/buttons.js

728x90
728x90


Plotly.js의 확대 기능을 이용한 후, 축소 방법은..
- 더블 클릭하면 처음 상태로 돌아온다.

728x90
728x90


Web 화면에 Video를 적용시켜, 동영상을 배경으로 사용 방법.

<video src="../chart_Web/video/main_video.mp4" muted autoplay loop></video>  

728x90
728x90


사이에 공백이 있을 경우 해결 방법!

section에 font-size : 0px;

- 단 이렇게 할 경우 자식에게도 font-size 상속된다.

728x90

+ Recent posts